Malcolm Knapp Research Forest
Malcolm Knapp is a 51 square kilometres boreal forest hub site located in British Columbia, near Vancouver within the Fraser Valley. To gain access to more raw data, please contact Amy Wotherspoon at UBC or access the Globus Portal using your verified account. [Click on any image to magnify]
Forest Monitoring
Site Details
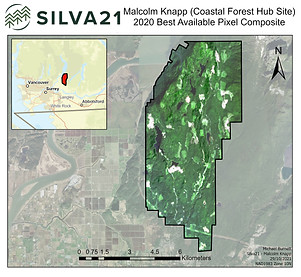


Best Available Pixel (2020)
Best Available Pixel (BAP) composites use Landsat scenes to develop cloud-free, surface reflectance pixel-based image composites capable of large-area production. When incorporated in a time series, they generate land cover, land cover change, and forest structural attributes information products in a dynamic, transparent, systematic, repeatable, and spatially exhaustive manner. This figure displays the 2020 BAP composite within the Haliburton hub site in Ontario. The acquisition of all pixels for this BAP composite were within 30 days of the first of August, 2020.
Malcolm Knapp Hub Site Boundary
Malcolm Knapp Digital Elevation Model (DEM) at 30 m resolution

Malcolm Knapp Digital Elevation Model (DEM) at 250 m resolution
Climate


Projections for change in seasonal minimum temperature for the years 2050 and 2090 relative to the reference period (1981-2010)
Projections for change in seasonal maximum temperature for the years 2050 and 2090 relative to the reference period (1981-2010)

Climate data for historical (1981-2010) and future (2050 and 2090) projections

Projections for change in seasonal precipitation for the years 2050 and 2090 relative to the reference period (1981-2010)
LiDAR Derived Products

Digital Elevation Model (1m)
Description - An interpolation of last returns classified as 'ground' points using TIN.
Pixel Values - Elevation at a 1 metre resolution.
Forestry Application - The Digital Elevation Model is important for topographical information, including slope, aspect, and radiation

Slope (1m)
Description - Steepness or the degree of incline of a surface based on the DEM model
Pixel Values - Raster containing numeric values representing degrees of incline
Forestry Application - Slope influences tree stability, harvesting solutions, productivity of harvesting and collection means, architecture of the road networks, road characteristics, and solutions related to the reclamation of degraded forested land.

Aspect (1m)
Description - Orientation of slope, measured clockwise in radians based on the DEM model
Pixel Values - Raster containing a numeric value representing the radians of orientation
Forestry Application - Land oriented in northerly are typically wetter and cooler compared to land oriented in southerly

Radiation (1m)
Description - A technique to visualize a shaded relief, illuminating it with a hypothetical light
Pixel Values - Raster containing a numeric value representing the solar-radiation aspect index. Values range from 0 (land oriented in a northern direction resulting in less solar radiation exposure) and 1 (land oriented with southern slopes)
Forestry Application - Land oriented in northerly (values closer to zero) are typically wetter and cooler compared to land oriented in southerly (values closer to one)

20th Height Percentile (20m)
Description - Height at which 20% of LiDAR returns fall below from 2m above the ground
Pixel Values - Height measurement in metres describing the height at which 20% of LiDAR returns fall below
Forestry Application - Assists in determining the height and distribution of the lower section of the canopy

95th Height Percentile (20m)
Description - Height at which 95% of LiDAR returns fall below from 2m above the ground
Pixel Values - Height measurement in metres describing the height at which 95% of LiDAR returns fall below
Forestry Application - Assists in determining the height and distribution of the lower section of the canopy


Canopy Height Model (1m)
Description - Based on an interpolation of the height of the top of trees (using the pitfree algorithm)
Pixel Values - Raster containing a numeric value for the distance between the ground and the top of trees
Forestry Application - Helpful for determining the distribution of canopy coverage
Mean Height (20m)
Description - Mean height of first returns above 2m from "ground" (last return data)
Pixel Values - Mean height of all point cloud returns greater than 2m above last returns
Forestry Application - Determines the mean height of all objects (trees) that are at least 2m tall
Mean Standard Deviation (20m)
Description - Standard Deviation of height distributions above 2m
Pixel Values - Standard deviation height of all point cloud returns greater than 2m above last returns
Forestry Application - Determines the standard deviation for the height of all objects (trees) that are at least 2m tall

Entropy (20m)

Skewness (20m)

Kurtosis (20m)
Description - Shannon entropy quantifies the diversity and evenness of an elevation distribution of LiDAR points from 2m above the ground
Pixel Values - Entropy results range from 0 to 1. Random data has a Shannon entropy value of 1
Forestry Application - Useful for describing and quantifying species diversity in biological systems.
Description - A measure of the distribution's symmetry from 2m above the ground
Pixel Values - A normal distribution would produce skewness results of zero. Negative values indicate that data is skewed to the left, and positive values indicate that data is skewed to the right.
Forestry Application - Skewness is often used with kurtosis to separate ground points and object points from a LiDAR point cloud. It has a variety of applications, including optimizing the DEM, segmentation and classification, and road extraction.
Description - The size of the tails of a distribution (likelihood that the distribution will produce outliers) from 2m above the ground
Pixel Values - A normal distribution would produce kurtosis results of 3. Distributions with kurtosis less than 3 are platykurtic (fewer and less extreme outliers) and distributions with kurtosis greater than 3 are laptokurtic (produce more outliers)
Forestry Application - Kurtosis is often used with skewness to separate ground points and object points from a LiDAR point cloud. It has a variety of applications, including optimizing the DEM, segmentation and classification, and road extraction.

Canopy Cover > 2m (20m)
Description - Canopy cover at a height greater than 2 metres
Pixel Values - Ratio from the sum of first returns > 2 metres divided by the total first returns
Forestry Application - Important for determining the area occupied by the vertical projection of tree crowns greater than 2 metres

Canopy Cover > 5m (20m)
Description - Canopy cover at a height greater than 5 metres
Pixel Values - Ratio from the sum of first returns > 5 metres divided by the total first returns
Forestry Application - Important for determining the area occupied by the vertical projection of tree crowns greater than 5 metres

Canopy Cover > 15m (20m)
Description - Canopy cover at a height greater than 15 metres
Pixel Values - Ratio from the sum of first returns > 15 metres divided by the total first returns
Forestry Application - Important for determining the area occupied by the vertical projection of tree crowns greater than 15 metres

LAIe (20m)
Description - A measurement of the gap fraction through the probability of beam penetration of sunlight through the vegetation.
Pixel Values - Ratio of one-sided green leaf area per unit ground surface area
Forestry Application - Important growth index for the status of crop populations

Rumple (20m)
Description - Crown Surface Roughness from 2m above the ground
Pixel Values - A ratio of canopy outer surface area to ground surface area
Forestry Application - Higher rumple values indicate more vertical and horizontal heterogeneity
Vector Products


